
What is your Risk Number?
Stop guessing with vague labels like "moderate" or "aggressive." We use a quantitative approach to pinpoint your risk tolerance: a number between 1 and 99 that aligns your portfolio with your true comfort zone.
From capital preservation to aggressive growth.
Your Risk Number replaces subjective labels with a precise, quantitative measurement. Here's what the scale means, and where your comfort zone might fall.
Conservative
Moderate Conservative
Moderate
Moderate Aggressive
Aggressive
"Moderate" isn't a number.
Old-school questionnaires ask how you feel. We measure how you act. See the difference between subjective guessing and objective measurement.
The Old Way
The Ashwood Way
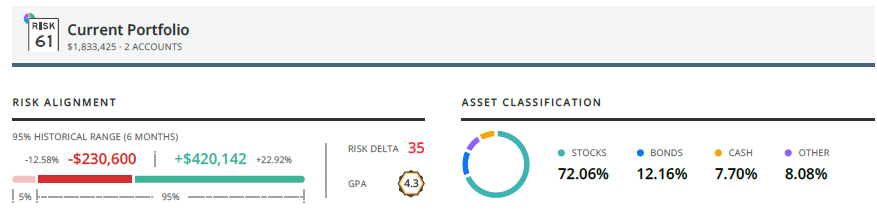
A 95% Historical Range. Measured, not assumed.
Nitrogen calculates a six-month 95% Historical Range for your portfolio from historical data and statistical inputs for the holdings you own today. It is a hypothetical statistical range, not a prediction.
Risk alignment, asset classification, and a GPA score, all in one dashboard. Actual results can fall outside this range; all investing involves risk, and results are not guaranteed.
Three numbers. One aligned portfolio.
Many advisors ask vague questions and assign a generic label. We use quantitative technology to answer three precise questions, and the answers drive every investment decision we make on your behalf.
Two CFA® charterholders on our team, Ashby W. Price and Chris Milligan, translate these three numbers into portfolio construction. Chris Milligan, who also holds the CFP® certification, connects them to the wider financial plan, because the risk you need depends on the goals you are funding. Meet the Team
Certified Financial Planner Board of Standards Center for Financial Planning, Inc. owns and licenses the certification marks CFP®, CERTIFIED FINANCIAL PLANNER®, and CFP® (with plaque design) in the United States to Certified Financial Planner Board of Standards, Inc., which authorizes individuals who successfully complete the organization’s initial and ongoing certification requirements to use the certification marks.
CFA®, Chartered Financial Analyst®, CIPM®, and GIPS® are registered trademarks owned by CFA Institute.
Risk You Want
Risk You Have
Risk You Need
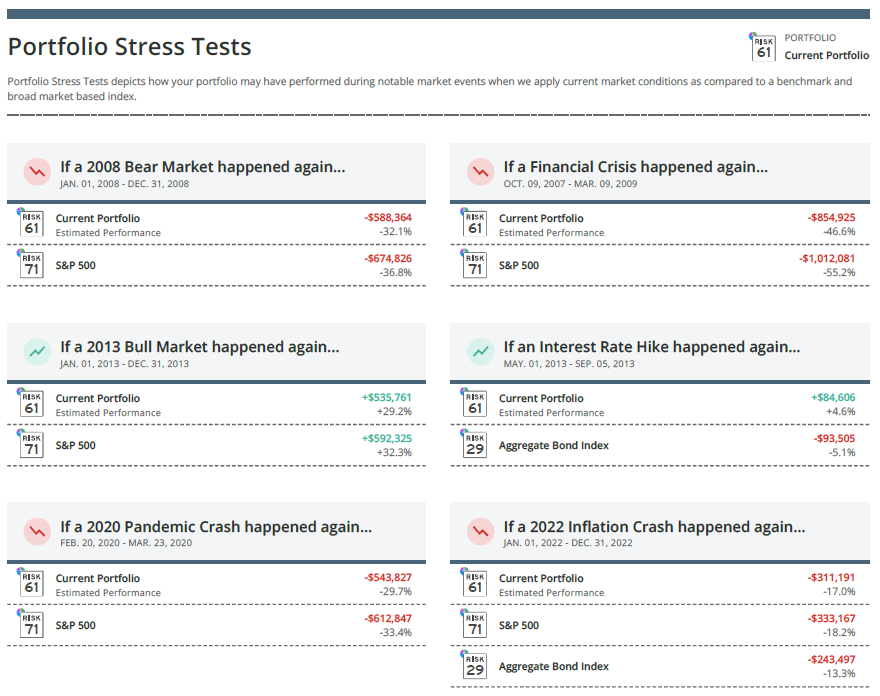
Will your portfolio survive the next 2008?
We don't hope for the best. Before investing a single dollar, we run your portfolio through major market crises in modern history and compare your projected losses against the S&P 500.
The result? We stress test a range of possible outcomes across various market conditions, helping you understand your downside risk and upside potential before you experience them.
Know your number. Invest with confidence.
Take the free 5-minute assessment. Just honest answers about your financial goals.
CommunityVotes Richmond 2025 Platinum Winner. Award based on community voting; not indicative of future performance or an endorsement by any regulatory body. CommunityVotes is not affiliated with Ashwood Financial Partners or Kestra Investment Services.